Auckland Sports College
|
"Moving Forward Together"
|

|
Level 2 Inference
|
The topics in Level 2 Inference are
|
|
This standard builds on the ideas of a dot plot and box and whisker graph from year 10. It introduces the ideas of sampling from a population and of confidence intervals. However, it is not essential background for the Level 3 inference standard and there are frustratingly strict requirements to use precise wording. Students with a full programme or in a hurry to complete the requirements of UE can skip this standard and proceed with Level 3 inference.
Although we have listed two textbooks in the table above, the best resources for this standard are Liz Sneddon's workbook and her youtube videos. The answers to the workbook questions are here
The assessment for this standard requires students to write a report with the PPDAC headings Problem, Plan, Data, Analysis, and Conclusion.
We use NZ Grapher (grapher.nz) rather than Inzight.
Preliminaries
- You are expected to do some research in this standard. There are two reasons for this. You are expected to have some knowledge of the context - the reason why the data was collected, who will find it useful and why? You are also expected to make a prediction, on the basis of your research, as to which median will be greater.
- Somewhere in your report you need to state clearly that your aim is to use the sample to make an inference about the population. The Plan is a good place to insert this sentence.
Problem/Question
Here is an example of a question from p15 of Liz Sneddon's workbook.Is the median travel time (minutes) for students who catch the bus longer than the median travel time (minutes) for students who walk, for all high school students in NZ, for data from Census at School in 2015?
You can use this wording for your question, which must have these things
- the word 'median' not average or mean
- the numerical variable and its units
- the categories (the two groups in your sample)
- the word 'greater'
- a definition of the population
- If you know where your sample comes from, state that source
Prediction
Your prediction can just be a rearrangement of your question "I predict that the median travel time (minutes) for students who catch the bus is longer than the median travel time (minutes) for students who walk, for all high school students in NZ, for data from Census at School in 2015."You should give a reason for your prediction. This might be something you found in your research.
Plan - Sampling
Page 29 of Liz Sneddon's workbook gives some information about various sampling methods. For this standard we use random sampling.
We include a little more information about sampling than Mrs Sneddon. Something like this
"I am taking a simple random sample. This means every individual in the population has an equal probability of being included in the sample. I need at least 30 (group 1) and 30 (group2) in my sample and will take a sample of (choose a number 80, 90, or 100) and expect to get at least 30 (group1) and at least 30 (group2). Thirty are needed for an informal confidence interval."
"The aim of my investigation is to use the data from my sample to make an inference about the population of (group1) and (group2) from (population). I will be able to make this inference if the informal confidence intervals do not overlap."
You can add additional information like "I will use NZ Grapher to draw the box plot and the box and whisker plot and to calculate summary statistics. I will also use NZ Grapher to calculate and display informal confidence intervals as a check on my working."
If you are seeking a high grade then you can expand on this section. Perhaps talking about what NZ Grapher is being used for, why you have chosen random sampling rather than another sampling method, or your choice of variable.
Data - Displays
Begin this section with a few introductory lines to provide context. Something like this"The Figure displays the sample data as dot plots and as box and whisker plots. Summary statistics as well as an informal Confidence Interval for the median of both the (group1) and (group2) subsets are given. The sample included (x group 1) and (y group 2), so there were more than 30 of each sub-group."
If your sample doesn't include 30 in each group, then take the sample again, perhaps increasing the sample size (use the 'reset' button in the 'Data' dropdown list)
You must show the informal confidence level and its limits. You can put everything in the one figure or you can show the informal confidence interval on a separate figure
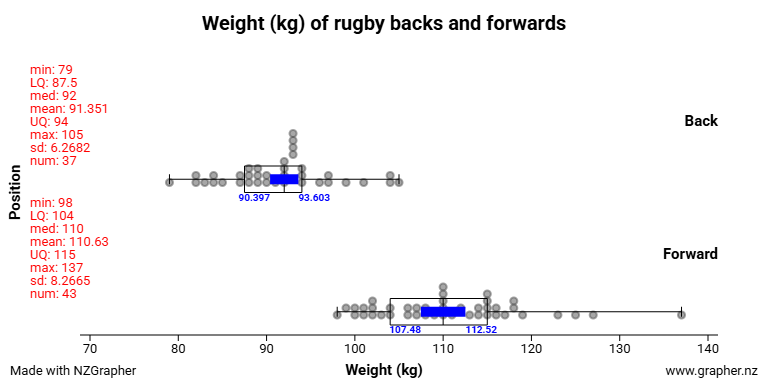
This graph is from the "rugby" dataset that is provided by NZGrapher.
Analysis
Your data is a sample from the population. Begin every paragraph of your analysis with "In my sample..."We look at
- Centre
- Shift/Overlap
- Spread
- Shape
- Interesting or Unusual Features
Just describing what you see is not enough. This is an analysis section. If the data supports your prediction say so. Provide the statistics and their units. If the spread in the two groups is not the same you can say "perhaps the variation in (group) is greater than the variation in (group) in (population). If the shape is unimodal and symmetric perhaps the distribution of (group) in (population) is normal. If there are outliers is there an explanation, peerhaps from your research?
Centre
In my sample the median weight of forwards is 104kg. This is 12kg more than the median weight of backs which is 92kg.
If this difference in the medians is in the direction you predicted you can add something like "This difference in the medians supports my prediction that the median weight of forwards is greater than the median weight of backs in (population)."
If this difference in the medians is in the opposite direction to what you predicted then your prediction is wrong. You can add something like "This difference in the medians contradicts my prediction that the median weight of forwards is greater than the median weight of backs in (population)."
Mrs Sneddon goes for a high grade in the workbook (page 61) by suggesting a reason for the difference "forwards need more muscles and weight to be able to both hold the line and push the line forwards, whereas backs tend to need to run fast, which often is less bulk than rugby forwards."
Shift/Overlap
You are interested in whether the middle 50% of data for the two groups overlap, and whether the middle 50% of data for the group that you predicted would have a larger population median is shifted to the right compared to the middle 50% of data for the other group.
In the rugby example "In my sample, there is no overlap of the middle 50% of data for backs and forward." If there had been an overlap you would describe what parts of the middle 50% of data overlapped.
"In my sample the middle 50% of data for forwards is shifted to the right compared to the middle 50% of data for backs. The minimum weight for a forward (98kg) is greater than the UQ weight for a back (94kg). This means that 100% of the forwards weigh more than 75% of the backs. This right shift supports my prediction that the median weight of forwards is greater than the median weight of backs in (population)."
Spread
You must calculate the IQR (UQ - LQ) for both groups in your sample. If they are similar, then the variation of the two groups in the population is likely to be similar
"In this sample the IQR (Interquartile Range) for the forwards is 11kg (115kg - 104kg). This is 4.5kg than the IQR for backs which is 6.5kg (94kg - 87.5kg) andd suggests that the variability in the weight of forwards may be greater than the variability in the weight of backs in (population)."
Shape
The Figure below is taken from p53 of Mrs Sneddon's workbook
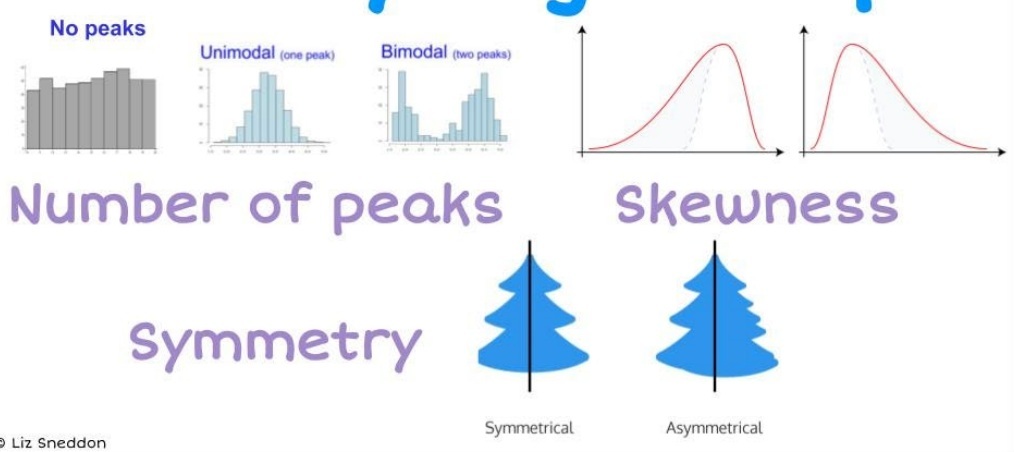
NZGrapher has a "shape" function which can be helpful. In your analysis you should mention the number of modes, the presence of left or right skew, and whether the data are symmetric. Use the statistics to back up your visual observation.
"In my sample the data for the backs is unimodal and symmetric. The visual observation of symmetry is supported by the statistics as the distance from the median to the minimum (92kg - 79kg) of 13kg is the same as the distance from the median to the maximum (105kg - 92). This suggests that the weight of backs might have a normal distribution."
"In my sample the weight of forwards is unimodal with the visual suggestion of right-skew. The mean of 110.63 is only slightly greater than the median of 110kg which does not support the visual observation of right-skew. The distance from the median to the minumum of 12kg (110-98) is considerably less than the distance from the median to the maximum of 127kg (if the outlier at 137kg is excluded) which is 17kg (127 - 110). This asymmetry does support the visual observation of right-skew."
Interesting or Unusual Features
NZGrapher has an "outliers" function which can be helpful. In your analysis you should mention the number of outliers (if any) in each group, provide their value, and suggest a reason.
"In my sample there is one outlier. This is a forward who weighs 137kg. Props are often the heaviest forward. This forward may be a prop."
Inference
There are not many words required for this section, but they are key words for passing this standard.
"The confidence interval is the region that is expected to contain the population median"
"The equation for calculating an informal confidence interval is Median ± 1.5*IQR/n1/2"
"For backs the informal confidence interval is 92 ± 1.5*6.5/371/2 = 92 &pm 1.6ks i.e from 90.4 to 93.6kg"
"I am pretty sure that the median weight for backs is between 90.4kg and 93.6kg."
"For forwards the informal confidence interval is 110 ± 1.5*11/43 = 110 ± 2.52kg i.e from 107.48 to 112.52kg"
"I am pretty sure that the median weight for forwards is between 107.48kg and 112.52kg."
Check that your calculation of the informal confidence interval produces the same interval (with any rounding) as NZGrapher. If it doesn't you have made a mistake.
Conclusion
There are not many words required for this section, but they are key words for passing this standard. The first step is to copy and paste your question.
"My question was 'Is the median weight (kg) of forwards greater than the median weight (kg) of backs in New Zealand and South African international rugby players?"
"My answer is that I am pretty sure that the median weight (kg) of forwards is greater than the median weight (kg) of backs in New Zealand and South African international rugby players?"
This is because there is no overlap of the informal confidence intervals for the medians of the two groups and in my sample the median weight of forwards (110kg) is greater than the median weight of backs (92kg). The confidence interval for the median weight of forwards in New Zealand and South African international rugby players is from 107.48 to 112.52kg while the confidence interval for the median weight of backs in New Zealand and South African international rugby players is from 90.4 to 93.6kg.
This conclusion supports my prediction that the median weight (kg) of forwards is greater than the median weight (kg) of backs in New Zealand and South African international rugby players
However, if there had been an overlap in the informal confidence intervals your conclusion would have said
"My answer is that there is not enough evidence to support the claim that the median weight of forawrds is greater than the median weight (kg) of backs in New Zealand and South African international rugby players."
"This is because there is an overlap in the informal confidence intervals of the two groups. They overlap from (specify the beginning of the overlap) kg to (specify the end of the overlap) kg."
"My prediction that the median weight (kg) of forwards is greater than the median weight (kg) of backs in New Zealand and South African international rugby players is not supported by this sample."
Sampling Variability
You must include a statement about sampling variability. The key point is that if you take another sample you will get different data and different values for the statistics, however the new confidence intervals for the population median are likely to contain the population interval (as the orginal confidence intervals did) so you are likely to come to the same conclusion.
Mrs Sneddon says (page 104) "If I took another sample, I would get different weights of school bags, as I would be collecting data from different students. I would expect though that the median weights of school bags for boys and girls at Intermediate schools in NZ is likely to be similar to the values I found in my sample. I also expect that my conclusion, that the median weights of school bags for girls is heavier than the median weight of school bags for boys, for ALL students at Intermediate schools in NZ, to remain the same."
We say something more like
"If I took another sample I would very likely get different sample statistics. I would very likely get different values for the minimum, maximum, mean, median, upper quartile, lower quartile, and so on, as well as slightly different confidence intervals. But the median values for the new sample will probably lie within the confidence intervals for the median calculated from the first sample
Also the new confidence intervals will probably (not) overlap and so I would reach the same conclusion."
If you take a larger sample the informal confidence intervals will be shorter, so if the confidence intervals from you sample overlap you could add "If I took a larger sample the informal confidence intervals would be narrower and I would be more likely to detect a difference in the population medians if they are different."
For Excellence
For excellence you need several references for your research and you need to relate your analysis to your research. A more detailed explanation of the sampling method (why you chose random rather than stratifed for exmple), an explanation of why you used median rather than mean, how you might perform the investigation differently if you repeated it. The limitations of your investigation.